Flow cytometry data analysis
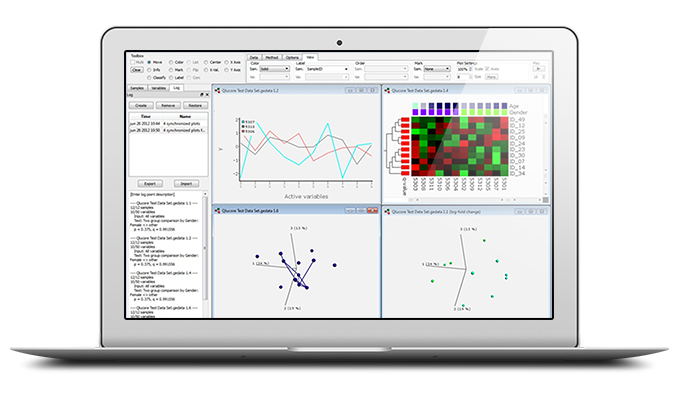
Qlucore Omics Explorer is the easy to use visualization-based data analysis software tool with inbuilt powerful statistics that delivers immediate results and provides instant exploration and visualization of flow cytometry data as well as a broad spectrum of other Omics data.
Software for Flow cytometry data analysis
Flow cytometry is a technology that rapidly analyzes single cells or particles as they flow past single or multiple lasers while suspended in a buffered solution.
Qlucore Omics Explorer is an easy to use flow cytometry analysis tool that can be employed both if you are using manual or automatic gating. You can use visualization and statistics tools to find outliers and subgroups among samples, along with discriminating features. To get data into the program some pre-processing is required to manage the feature extraction and end up with a sample-based data table, either in comma or tab separated format. This is then easily imported. For details see the documents below.
Does it work on my data?
Answer the four quick questions below and find out if you can use Qlucore on your data.
For more details about supported data formats and data import see Data Import or Contact us with questions.
Documents
How To Work with Flow cytometry data
This document outlines a few different ways to use Qlucore Omics Explorer (QOE) for flow cytometry data analysis. We will show how to use visualization and statistics tools to find outliers and subgroups among samples, along with discriminating features.
How to work with Flow cytometry data - example
This is an accompanying document to ”How to Work with Flow Cytometry Data”, with a self-contained example based on automated gating.


