


VIDEO and FREE TRIAL
Qlucore Omics Explorer video
Qlucore Omics Explorer free trial
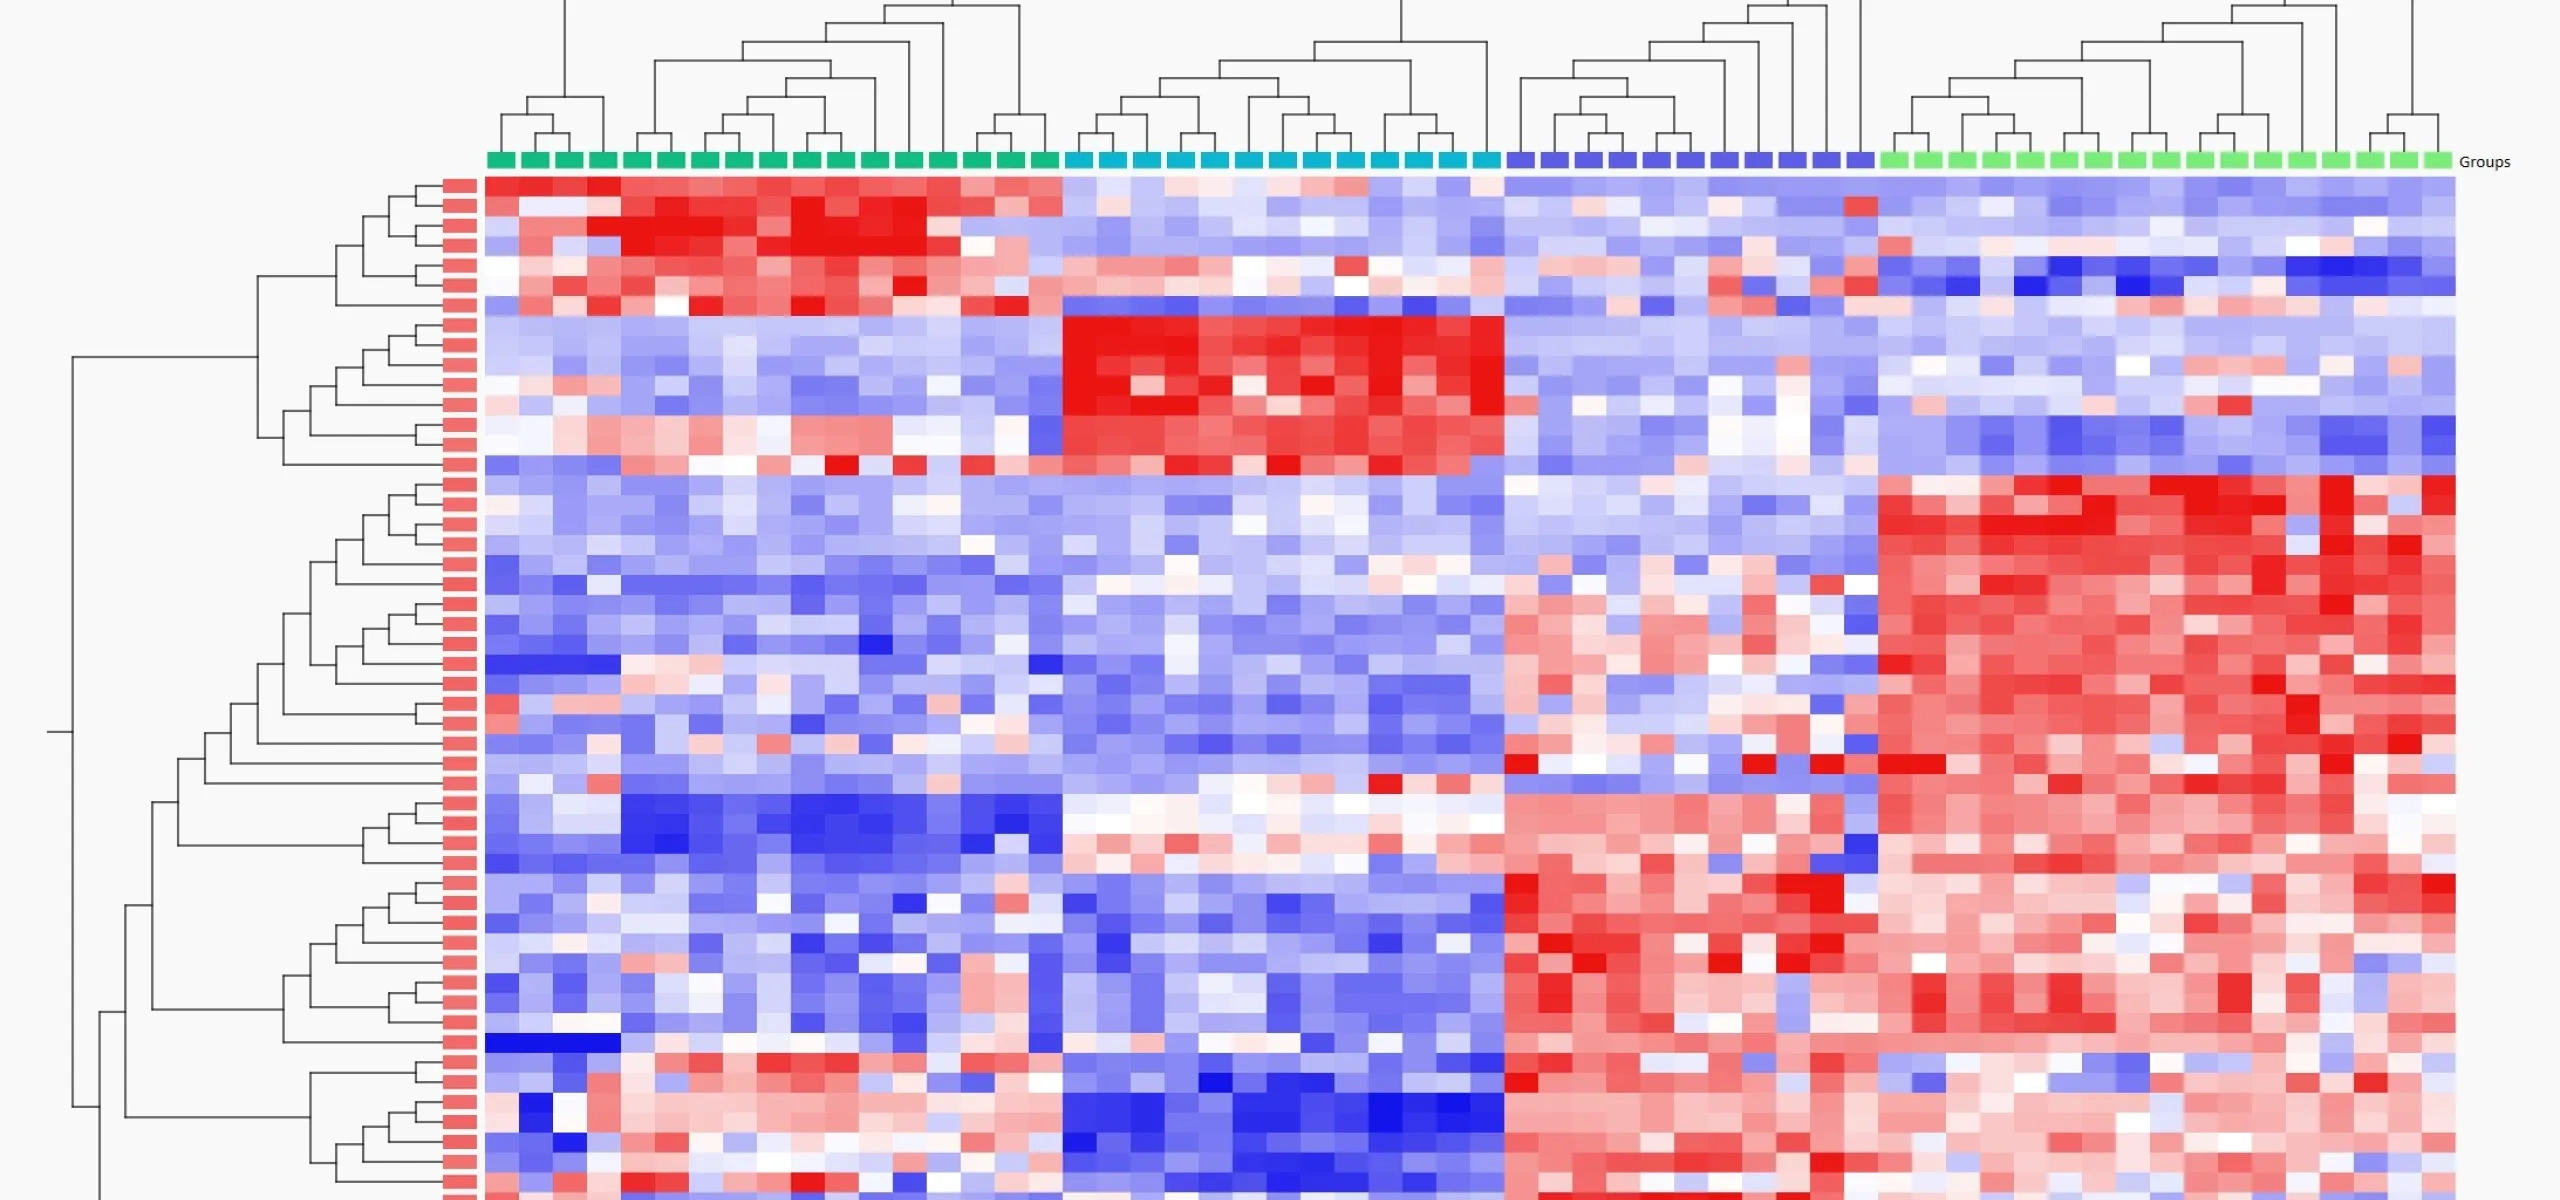
Qlucore Omics Explorer is the powerful visualization-based data analysis software tool with inbuilt powerful statistics that delivers immediate results and provides instant exploration and visualization. The program supports a broad spectrum of Omics and NGS data. Generation of heatmaps is fast and easy.
With a few key-presses a heatmap is generated and organized according to your needs. Select color scales, ordering, annotation visualizations and labels freely. Inspect the whole plot or parts of it. The visualizations in the heatmap capable software are both the starting point and a possible endpoint in your data analysis work flow. Many plot types are supported, heatmaps (heatmaps or heat-maps) are only one example.
The heatmap is interactive and will automatically display all your active variables. Hierarchical clustering as well as several other different sorting orders can be applied. Inspect your data using the heatmap and then start to dive into the analysis.
With a right click the resulting plot is copied to the clipboard. One of many fast ways to export results including plots.

Answer the four quick questions below and find out if you can use Qlucore on your data.
For more details about supported data formats and data import see Data Import or Contact us with questions.