Gene expression
Qlucore Omics Explorer is a next-generation bioinformatics software for research in life science, biotech, food and plant industries, as well as academia. The easy to use visualization-based data analysis tool with inbuilt powerful statistics delivers immediate results and provides instant exploration and visualization of multi-omics and NGS data including gene expression data.
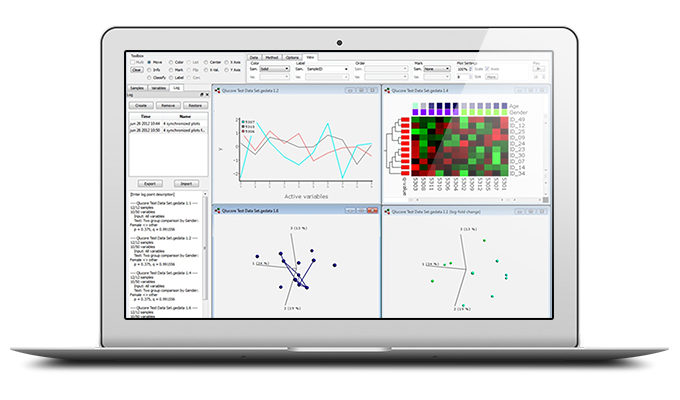
Gene Expression Analysis made easy
The gene expression analysis software is easy to use. With a few mouse clicks the discriminating genes are identified and results are available in publication ready lists and plots.
Data can be generated either by RNA-seq techniques or through microarrays . Direct import and normalization is available for aligned BAM files coming from any NGS platform and for data from ThermoFischer (Affymetrix) and Agilent.
Direct download of data from TCGA and Gene Expression Omnibus are also available.
RNA-seq data can be analyzed with the Qlucore Omics Explorer base module. If you add the NGS module many more options are available - it will for instance be possible to analyze data in a synchronized model both doing statistical filtering on expression levels and filter on genomic entities. All this can be done with synchronized plots such as a Genome browser and a heatmap or PCA plot. Gene expression analysis can be combined with Chip-seq data.
Scripting and automation of workflows is possible with the Python based scripts.
Key functionalities:
- Identify discriminating genes with a few mouse clicks
- Show results in the flexible and easy-to-use heat map with hierarchical clustering
- Verify your hypotheses using powerful statistics including DESeq2 methods and ANOVA and different forms of regressions
- Compare with pathways and other biological information using the integrated and user friendly Gene Set Enrichment analysis (GSEA) Workbench
- Explore new ideas focusing on gene and sample subsets with Dynamic PCA
- Heatmaps, box plots, UMAP plots, bar plots, line plots, PCA plots and more, both in 2D and 3D
Does it work on my data?
Answer the four quick questions below and find out if you can use Qlucore on your data.
For more details about supported data formats and data import see Data Import or Contact us with questions.
Case Studies
Qlucore analysis of transcriptomic data
University of Manchester, UKThe study includes working with data from more than 400 arrays. Visualization is used in the effort to understand the human growth process.
RNA-Seq analysis using Qlucore
Stanford University, USPerforming gene expression analysis based on RNA sequencing data, in Dilated Cardiomyopathy studies.
Analyzing proteomics and transcriptomics data
National Institute of Nutrition and Seafood Research (NIFES), NorwayStudy of hundreds of entries about pollutants and nutrients in different fish species, showing how levels are changing over time.


